UPDATE -- Good news: Apparently the major spike in cases attributed to Montour County early in December was an accounting error and those confirmed cases are actually being apportioned out elsewhere. Bad news: The reapportioning is somewhat offsetting other apparent drops in cases whether in the valley or somewhat further afield. The way the state issues the corrections, it is hard to recreate all the graphs day by day, but we are keeping our graphs as current as possible. The general trend described in the post still holds.
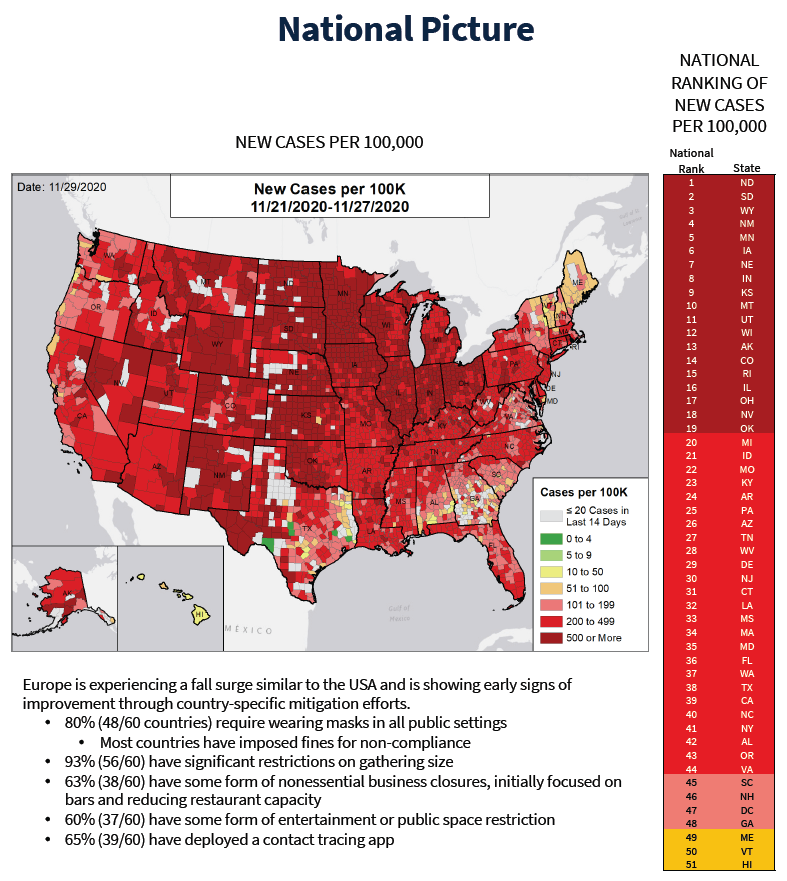
We are in a serious situation. The White House Coronavirus Task Force report for Pennsylvania for the week ending November 29 paints a bleak picture for the nation, for PA, and for our area. Not to put too fine a point on it, their recommendations to the PA Department of Health include these admonitions in a single bullet about key public messaging for this period:
- "If you are over 65 or have significant health conditions, you should not enter any indoor public spaces where anyone is unmasked due to the immediate risk to your health; you should have groceries and medications delivered."
- "If you are under 40, you need to assume you became infected during the Thanksgiving period if you gathered beyond your immediate household. Most likely, you will not have symptoms; however, you are dangerous to others and you must isolate away from anyone at increased risk for severe disease and get tested immediately."
- "If you are over 65 or have significant medical conditions and you gathered outside of your immediate household [during the Thanksgiving period], you are at a significant risk for serious COVID infection; if you develop any symptoms, you must be tested immediately as the majority of therapeutics work best early in infection."
If this sounds familiar, that's because it should. It is largely hearkening back to what we were hearing early on (with less emphasis, though not no emphasis on surfaces). These are the same restrictions, but restated with more urgency and they need to be applied more stringently. To be honest, had we been doing a better job of applying them all along, we would not be in the current situation...
As a country, as a state, and as a region, we are in an infection, hospitalization, and ICU spike comparable to what was unfolding in the spring. Deaths are also on the rise, already matching the spring on a national level. Locally they have increased far beyond early levels in tandem with the rise in cases. The local increase is inexorable, though not precipitous... yet. Deaths track cases and hospitalizations -- but with a lag -- so we are just now dealing with the deaths from the more moderate increase in cases from early November. Deaths associated with the cases that started taking off in mid- to late- November are starting to show up now.
Many locals are quick to point out that we weren't part of the big national spike in the spring. In retrospect it turns out we did avert it, which is different from saying nothing happened at all. Looking back, there was an impending spike to be averted. If you look at the incidence rate early on, you will see that we were indeed at the beginning of a potentially large growth in cases which we managed to head off through massive behavior change from the blunt tool of the lockdown. We also now have new insight into what was really happening in that period thanks to a new 30-minute documentary put together by Geisinger entitled "Five Days in May." At the end of the film, they include tables showing that the overload they experienced at the peak in the spring had already been exceeded by mid-November.
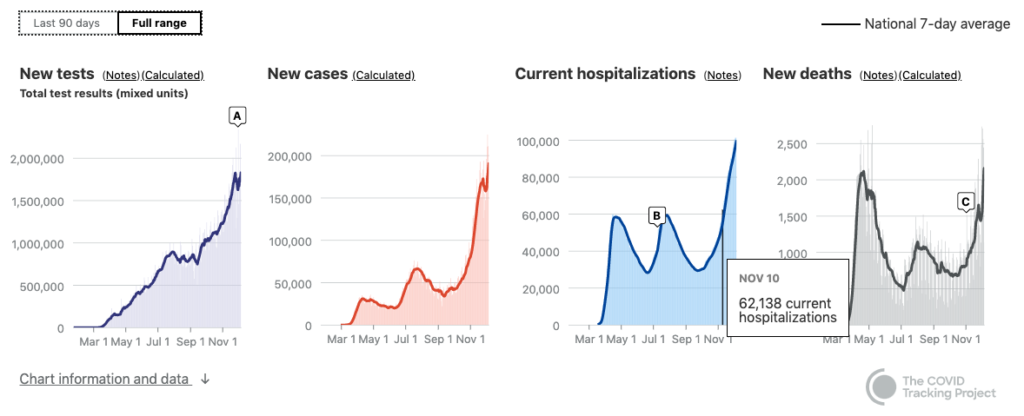
As the numbers climb, those who are in denial are hard at work, massaging their readings of the reports. But if you have been paying attention, it is not unclear what is underway and gradually unfolding. As noted in our "How to Read a Graph Mid-Pandemic" post, there has been a lot of confusion about how current numbers compared to the spring or summer. While it is true that it is very difficult to compare cases counts over the course of the year and even hospitalizations have some variability, deaths are comparable. And implacable.
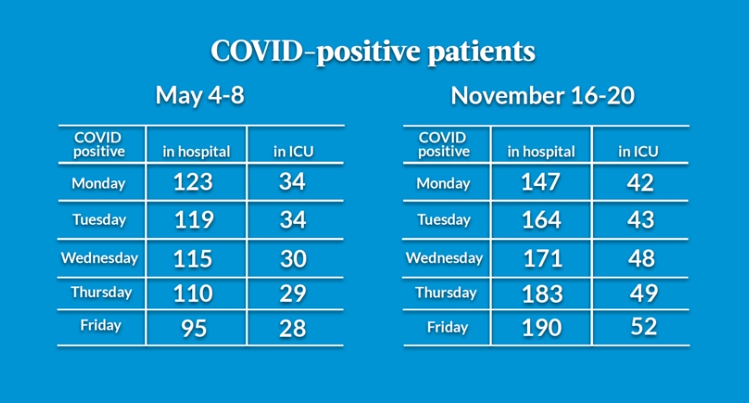
The daily hospitalization count from the spring peak was matched by November 10. It wasn't until the beginning of December though that the daily death tally for the nation reached the level of the peak in the spring. In spring that peak was primarily felt in NYC and its surroundings as well as a few other cities around the region and the country. We are now achieving similar totals but spread out across the vast and relatively sparsely populated center of the continent. On the one hand, this distributes the load both in terms of facilities, gear, and staff. On the other, that just means we start with more range but are headed towards a less negotiable upper limit.
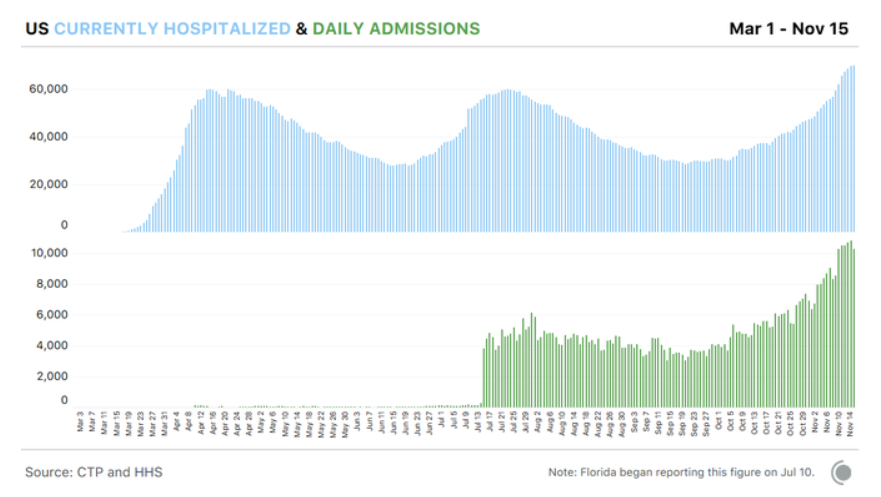
We can also start to see how all hospitalizations are not equal. In data newly made available by HHS, we can compare for instance the distinction between daily number of hospital beds occupied and daily hospital admissions, the former being what we have been counting all along. This is a critical distinction because COVID hospital stays can range anywhere from 1 or 2 days to 5 or 6 weeks. So the demand for hospital beds to be occupied at length that correlates with the new higher and rising number of admissions happening right now is worrisome.
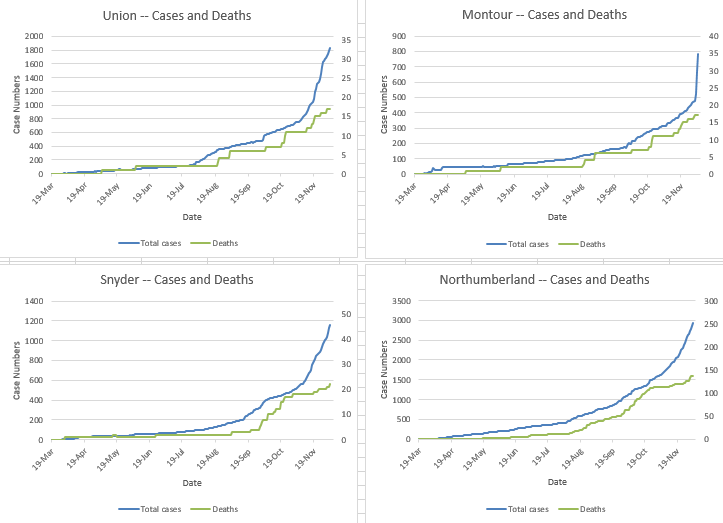
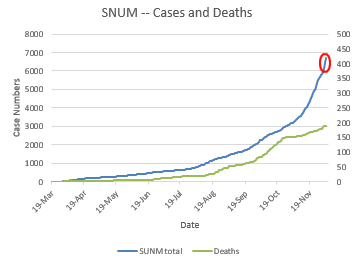
Here are some current graphs incorporating both cases and deaths in our local area. These graphs overlay cases, in blue, using the left-hand vertical axis for scale and deaths, in green, using the right-hand vertical axis for scale. You can see how deaths lag pretty clearly. A couple weeks after the slope of the blue line shifts upward, the slope of the green link rises. And you can also see that the deaths from the most recent/current spike in cases have not yet arrived.
Previous graphs posted on this site have not included deaths. It was not that there weren't any, but that there were relatively few and the trends were subtle (less so in Northumberland County which has had a higher death rate to date than the Dakotas, though they are on track to top it shortly; 1 in 670 NU residents has died of COVID this year; ND and SD are just above 1 in 800 so far). It has up to now been easier to read the patterns and lags in the state and national data. They are now becoming more legible locally.
So what happens next? That is, what happens after the baked in rise in hospitalizations and deaths from the cases already reported and the activities that have taken place through today? It is up to us. We write the future.
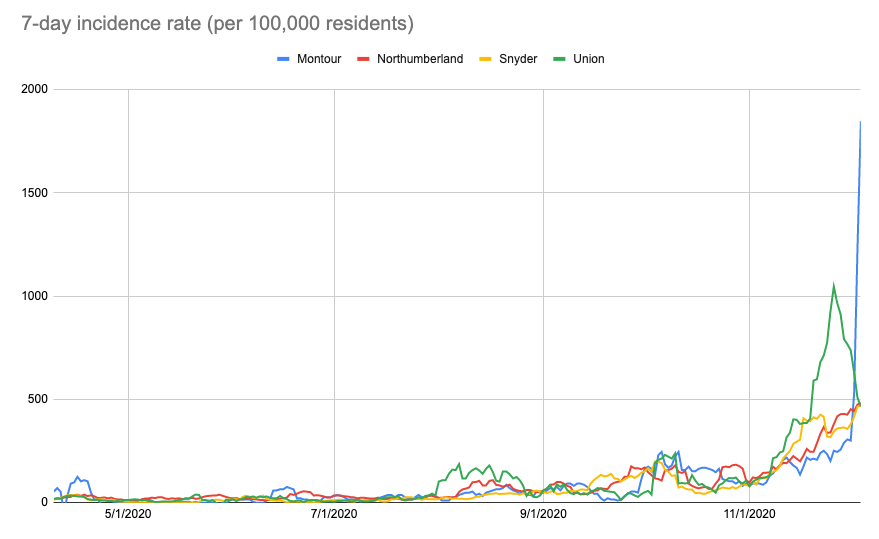
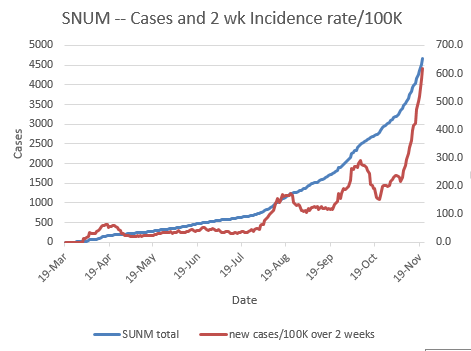
Keep this chart of incidence rates for valley counties in mind. As you can see, Montour appears to be skyrocketing. As of Dec 6, they have doubled their total confirmed cases in the past four days. It is/may be a distinct and undeniable outbreak that broke the scale on the state GIS map (update: or maybe it's a reporting/accounting error and those cases will wind up adding to tallies for multiple counties instead).
Also note that in this graph Union County's incidence rate peaked on Nov 26 and has dropped since. That seems to indicate we upped our mitigation efforts after Nov 12 or so. Maybe. (Update: owing to the reporting error, this is even more uncertain; all info lags and this just adds another week to our ignorance of the consequences of our past actions.) If so, yay, us. The question is how badly did we then blow it over the Thanksgiving weekend? Next week will start to tell that tale. And of course, this weekend there were some large indoor gatherings in the area with eating and singing at different churches...
So, what have we been doing over the past two weeks? You don't know at the time whether you or those you're interacting with are infected... Have we been cautious in our interactions and conscientious in our practice of mitigation measures? Here's hoping so!