
Apps and calculators:
- COVID Alert PA app
- COVID Symptom Study -- Massachusetts General Hospital
- My COVID Risk app -- assessing risk for specific activities and risk factors
- COVID-19 Event Risk Assessment Tool -- calculator for gatherings by county
National statistical summaries:
- White House Coronavirus Task Force profile report for PA from Nov 29 -- featuring the greatest hits of if you're over 65, you shouldn't go into any public place where someone is not masked and if you're under 40 and you went to Thanksgiving, you are probably infected but asymptomatic
- White House Coronavirus Task Force profile report for PA from Dec 6 -- featuring indoor gatherings BAAAAAAD and asymptomatic spread BIIIIIG
- The newest WHCTF PA report is finally out, dated Dec 20 -- check it out
- Department of Health and Human Services Dec 21 national data presentation -- national maps based on county-level data
Relevant current articles -- (list compiled in mid-November, still super relevant in December!!!):
- Precautions/quarantining/testing for college students returning home for the holidays -- article from NPR, article from NYT
- Thanksgiving misgivings --
- column by Connie Schultz
- Canadian Thanksgiving opportunity to learn from their (bad) experience
- Greater Susquehanna Valley United Way COVID-19 Public Health Forum from Nov 19 -- local healthcare professionals explain the presence of virus in the valley and the need to curtail gatherings this year (forum starts at 19:30)
- Thanksgiving creativity --
- Plantsgiving -- a creation of Dr. Chris Martine, Bucknell botany professor
- Zoomsgiving
- Dear Pandemic on WKOK's Sunrise Show on Nov 19
- Checkup on Sweden -- they disavow their earlier strategy and acknowledge that they are in a bad situation now
Current data visualizations (some will be familiar, others are new):
- COVID Estimator -- graphs the estimated infections throughout, not just confirmed or probable; also Rt and seroprevalence estimates
- PA DOH Dashboard -- some updates and more functionality from earlier in the year
- PA Early Warning Monitoring System Dashboard -- weekly transmission ratings by county, 7-day incidence rate and test positivity (inconsistent inclusion of college campus tests sometimes excessively diluting local testing data)
- The COVID Tracking Project -- incorporates hospitalization data
- NYTimes COVID map -- interface allows for national and county overview at once
- Washington Post COVID map -- interface allows for nation and statewide data at a glance
- Johns Hopkins University COVID Dashboard -- additional features from earlier in the year
- Worldometer -- table of current stats, updated daily, for US and the entire globe
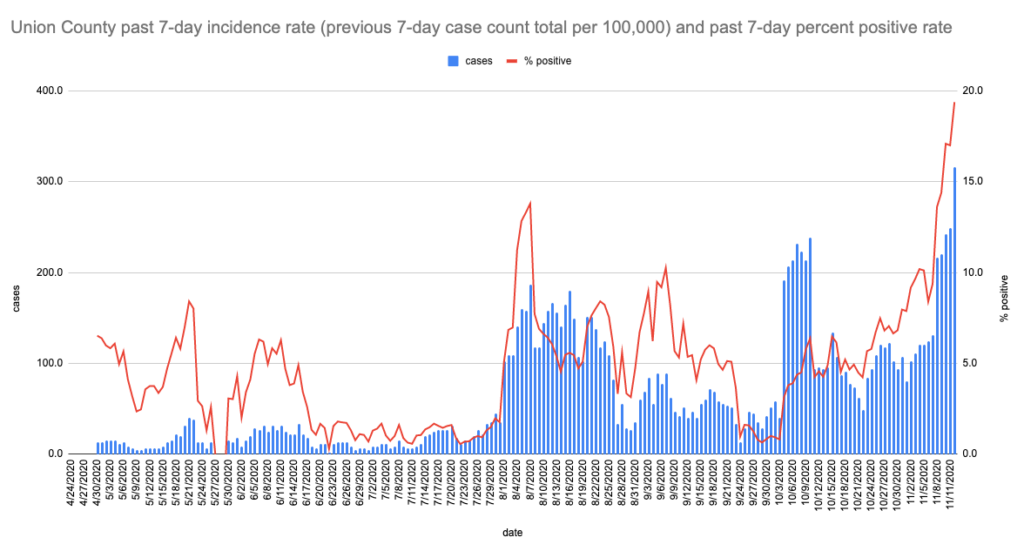
Union County-relevant info:
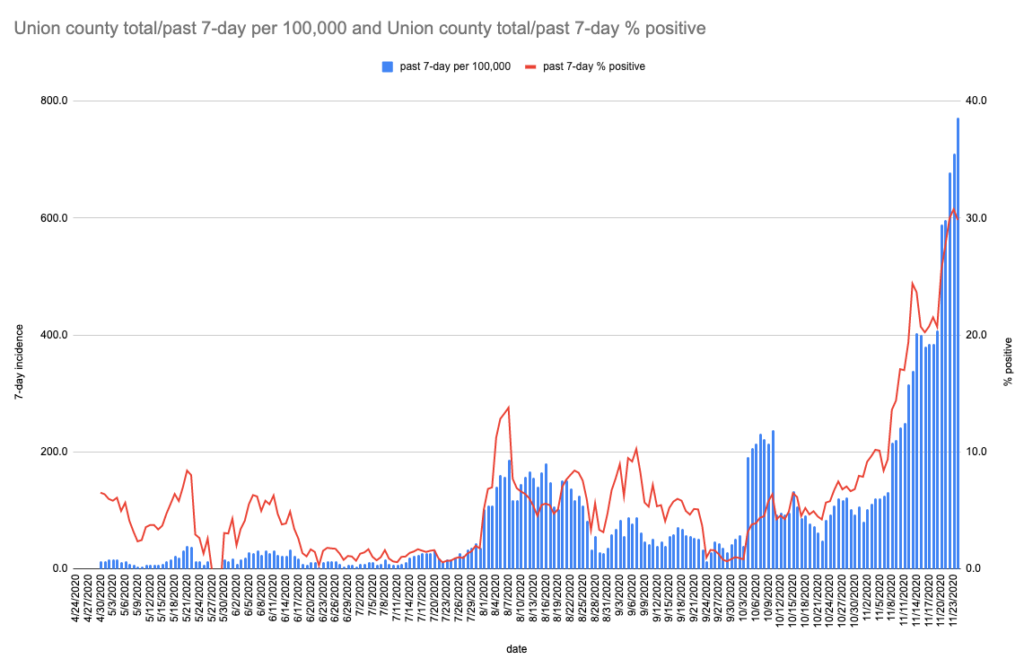
In addition to the above, some local data wranglers are taking the DOH numbers provided daily and graphing key info for just Union County. Like the below:
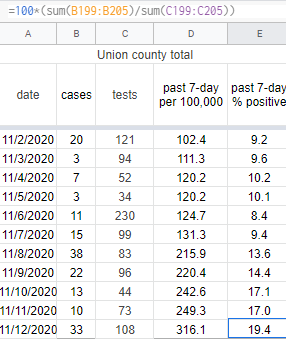
In-house calculations of test positivity are based directly on the figures for positive cases and total tests run and reported by healthcare providers in the county. When this week's Early Warning Monitoring System Dashboard reading came out, the Union County numbers had shifted to 321.5 for the incidence rate and only 3.2% for the test positivity rate. The latter figure does not agree with our calculation of the positivity rate which we had calculated at that same time at a whopping 19.4%. Unfortunately the state DOH does not provide insight into how they calculate test positivity. That said, they do provide the data from which we have calculated our number.
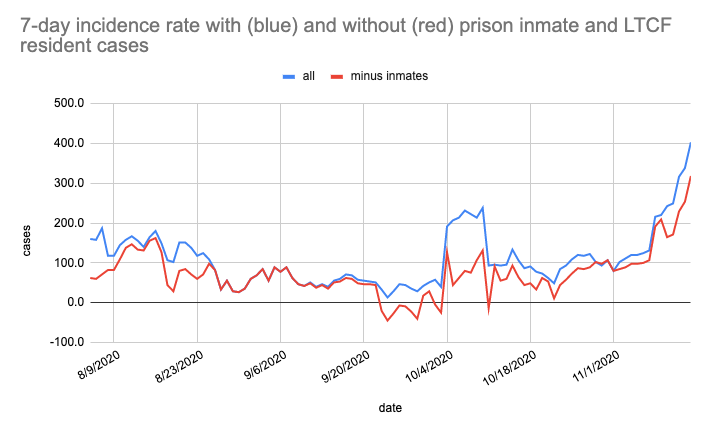
There are judgment calls to be made about which data to include. It has seemed like the state previously made the reasonable call to not include the many many tests being done as part of the assurance or surveillance testing at Bucknell. Including those numbers would artificially lower the test positivity precisely because they have been blanket testing everyone on campus, regardless of exposure or symptoms, roughly once every 2 weeks (about 500 tests/day). They then stepped that up even further after the first signs of an outbreak three weeks ago, to around 600/day (though only reported once a week). For reference, the campus test positivity rate has been on the order of 0.5% for most of the semester.
Since the semester began they have been conducting far more tests than have been done for the general population of Union County (more on the order of ~100/day over the past few months). Adding the campus surveillance tests in would have completely obliterated any reading of fluctuations in test positivity among those with symptoms or exposures off campus. So it clearly made sense to not include them. We have continued to not include them since the BU outbreak 3 weeks ago, but it's possible that the DOH is now considering everyone on campus to have had a potential exposure and has started to include them. We are using the data as reported by the state for the county and doing the math from that.
December Update: Still more recently it has come out that the state is using confirmed cases rather than probable cases in their calculations. This makes less difference when there are fewer cases being diagnosed overall, but with larger day-to-day jumps and more people being ID'ed as probable as they await their test results, the calculations have moved further apart. As of mid-December we are trying to update our Union County calculations. End result -- still way high!
